Most business owners in India check WhatsApp first thing in the morning. They open conversations, look for updates from their sales team, scroll through yesterday's follow-up messages, and try to piece together — in their head — how the business is actually doing.
This is not a business dashboard. It is a fire-fighting ritual. And it is one of the main reasons promising businesses plateau instead of grow.
A CRM dashboard changes this completely. When it is built right and used consistently, it becomes the first thing you open — not to check messages, but to understand your business in seconds. Where are the leads? Who is following up? Which deals are stalling? What changed since yesterday?
This article explains what a CRM dashboard really is, why it is critical for Indian SMBs specifically, and what elements of a dashboard actually drive business growth versus what just looks impressive.
A CRM dashboard is a real-time, visual summary of everything that matters in your sales and customer pipeline — so you can make decisions with data instead of gut feel.
What Most Business Owners Are Actually Doing — And Why It Fails
Before we talk about dashboards, let us be honest about the alternatives most Indian SMBs are using today.
| What many SMBs use | The real problem |
|---|---|
| WhatsApp groups for lead updates | No structure, no history, no accountability — leads get buried in chats |
| Excel sheets for pipeline tracking | Always outdated, no one updates it consistently, no real-time view |
| Weekly team meetings for updates | 7 days of lost time between insights and action |
| Verbal check-ins with the sales team | Relies on memory, creates pressure, misses what no one wants to report |
| Nothing — running on instinct | Works when there are 5 leads. Breaks completely at 50. |
The common thread in all of these is that visibility is delayed, incomplete, or dependent on someone reporting it to you. A CRM dashboard removes this dependency entirely. The data updates itself.
The 6 Dashboard Elements That Actually Drive Business Growth
Not everything on a dashboard matters equally. Here are the six elements that move the needle — and what each one tells you that you cannot easily learn any other way.
Total & Active Lead Count — Your Business Pulse
At a glance: how many active opportunities exist in your pipeline right now. A drop here is an early warning sign — your lead generation needs attention before sales feels the impact two months later. The dashboard shows this before your accountant does.
Pipeline Stage Breakdown — Where Deals Are Stalling
The Clientfisher dashboard breaks leads into Lead, Contact, Prospect, Opportunity, and Closed stages. When you see 5 leads stuck in "Qualified" for three weeks, that is not a data point — it is an action item. Pipeline stage visibility tells you where to intervene before deals go cold.
Open Follow-up Reminders — The Number That Protects Revenue
78% of deals are lost simply because no one followed up on time. Open reminders on the dashboard make this impossible to ignore. When your team sees 10 open follow-ups, they know exactly what to do before they open a single email or WhatsApp message.
Leads by Status Chart — Spotting Patterns in Your Pipeline
The bar chart showing leads across Interested, New, Qualified, Negotiation, Contacted, Closed Lost, and Proposal Accepted stages reveals something daily meetings never will: systemic patterns. If "Negotiation" always has 4–5 leads but "Closed" rarely gets more than 1, your conversion script needs work — not your team's effort.
Recent Leads Feed — React in Real Time
Every new enquiry from TradeIndia, IndiaMart, or your website appears here the moment it arrives. With the recent leads panel visible, your team can respond within minutes — not hours. Speed of first response is one of the highest-leverage sales improvements available to any SMB.
Team-level Activity Visibility — Accountability Without Micromanagement
When every executive's lead count, follow-up rate, and pipeline movement is visible on the dashboard, performance conversations shift from opinions to facts. The manager does not need to ask "What did you do today?" — the dashboard already shows it.
How a CRM Dashboard Directly Impacts Business Growth
The connection between dashboard visibility and business growth is not abstract. It operates through four specific mechanisms.
🚀 Faster Lead Response
- New leads visible the instant they arrive
- Assigned executive notified immediately
- Response time drops from hours to minutes
- First-response speed directly increases conversion
🎯 Better Sales Prioritisation
- Pipeline stages show where to focus effort
- High-probability deals are easy to identify
- Stale leads flagged before they go cold
- Team time goes to opportunities, not admin
📈 Accurate Revenue Forecasting
- Deal probability visible per opportunity
- Expected closure dates tracked in real time
- Management can forecast next month's revenue
- Decisions based on data, not gut feel
🔁 Consistent Follow-up Culture
- Open reminders visible to the whole team
- No lead falls through without accountability
- Follow-up patterns become a measurable habit
- Managers coach on data, not impressions
Each of these four improvements compounds. Faster response increases qualified leads. Better prioritisation increases conversion. Accurate forecasting enables better hiring and investment decisions. Consistent follow-up builds a culture that retains customers. A CRM dashboard does not just track growth — it creates the conditions for it.
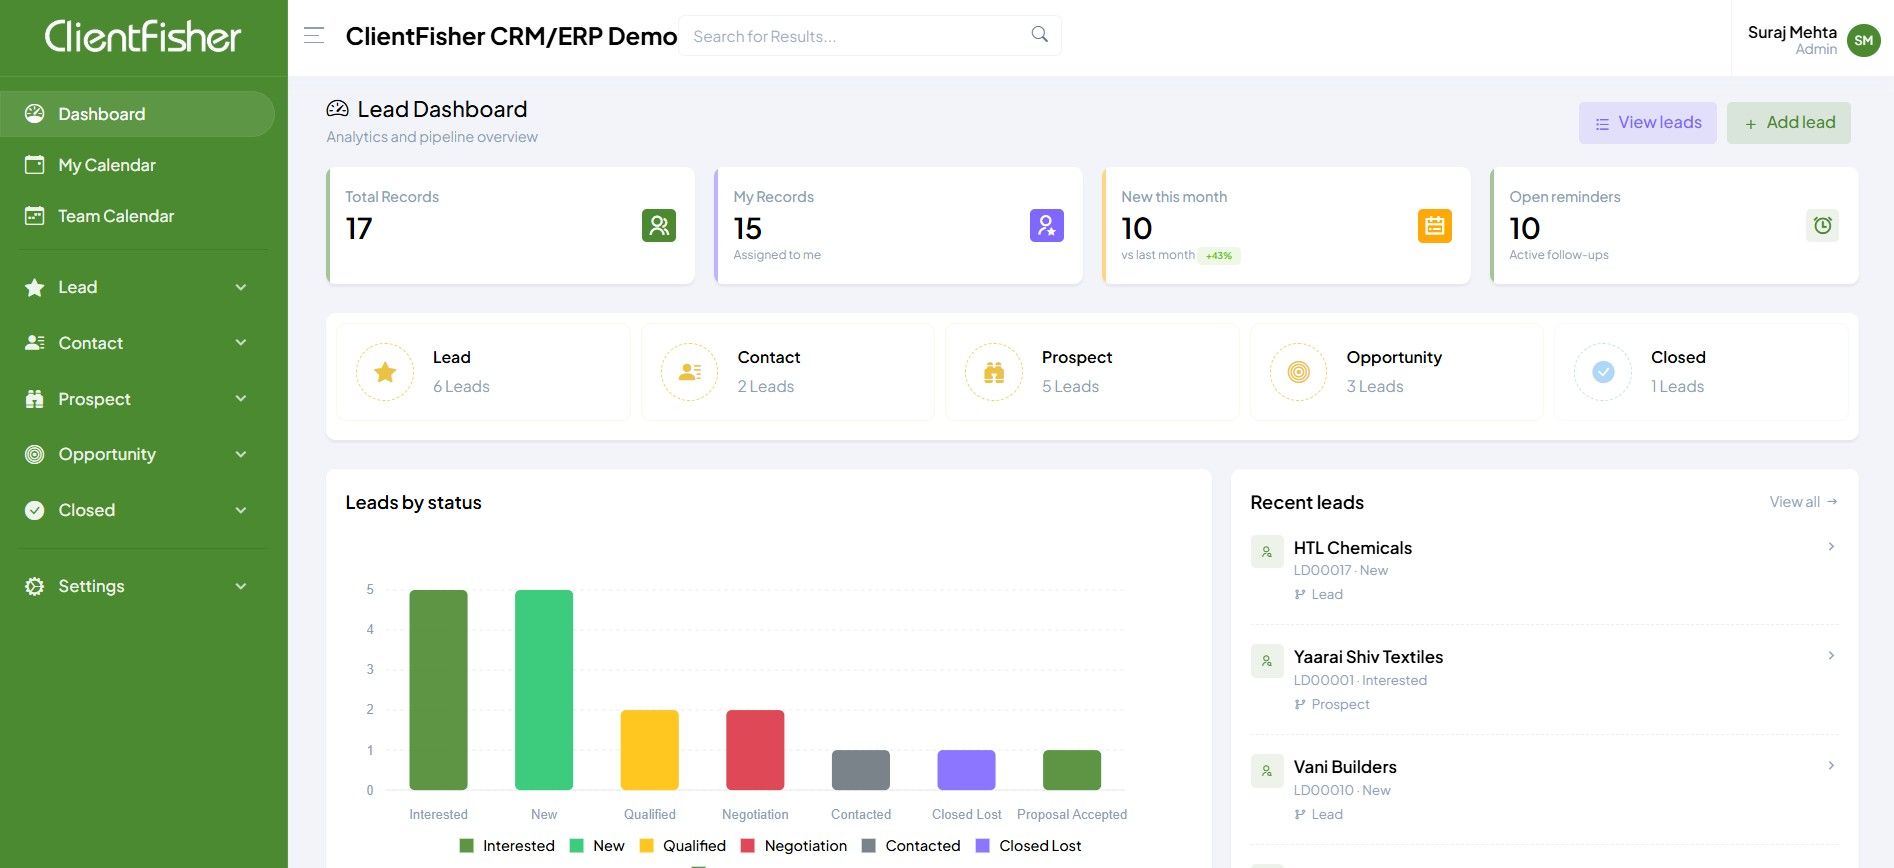
What the Clientfisher Lead Dashboard Shows You
The Clientfisher lead dashboard is designed around the real workflow of an Indian SMB — not an enterprise sales team with 200 reps. Here is what you see the moment you log in:
- ✓ Total Records — full pipeline count at a glance
- ✓ My Records — leads assigned to the logged-in executive
- ✓ New This Month — with month-on-month percentage change
- ✓ Open Reminders — active follow-ups requiring action today
- ✓ Leads broken into Lead → Contact → Prospect → Opportunity → Closed
- ✓ Count per stage visible instantly — no drilling required
- ✓ Click any stage to see the full list of leads within it
- ✓ Visual bar chart across Interested, New, Qualified, Negotiation, Contacted, Closed Lost, Proposal Accepted
- ✓ Colour-coded for instant pattern recognition
- ✓ Spot bottlenecks in the funnel — where leads are accumulating and not moving
- ✓ Latest leads from all sources: TradeIndia, IndiaMart, website, manual entry
- ✓ Shows lead name, ID, source, status, and stage — no need to open each record
- ✓ One click to open and begin working the lead directly
The Difference Between a Dashboard That Looks Good and One That Works
Many CRM tools give you a dashboard full of charts and numbers that look impressive in a demo but provide little operational value. Here is how to tell the difference:
| Dashboard Quality | Looks-good Dashboard | Works-well Dashboard |
|---|---|---|
| Data freshness | Updated daily or manually | Real-time, updates instantly |
| Actionability | Shows data, no next step | Each metric links to action |
| Relevance by role | Same view for everyone | Executive sees their leads; manager sees team |
| Follow-up visibility | Buried in a report | Front and centre — open reminders count |
| Mobile access | Desktop only | Full mobile app with AI dashboard builder |
| Source tracking | All leads look the same | IndiaMart, TradeIndia, website — all tagged |
AI on the Dashboard: Asking Questions Instead of Building Reports
Clientfisher's mobile app includes an AI dashboard builder — a feature that takes the idea of a dashboard further than a static screen. Instead of configuring reports, you simply ask for the view you need.
Type or speak: "Show me leads where I sent a quotation in the last 20 days that haven't had a follow-up." The AI instantly surfaces that exact list — without building a report, applying filters, or exporting to Excel. This is the direction CRM dashboards are heading, and Clientfisher already has it.
For a business owner who does not have time to configure dashboards but needs answers quickly, this is transformative. The management team gets AI-generated observations, trend analysis, and performance insights delivered without asking for them.
Who Benefits Most From a CRM Dashboard
A well-designed CRM dashboard serves every level of the business differently — and that is its strength.
👤 Sales Executive
- Sees their assigned leads instantly
- Follow-up reminders front and centre
- Recent leads to act on immediately
- Pipeline stage to update from one screen
👥 Sales Manager
- Team-level pipeline visibility
- Identify who is behind on follow-ups
- Spot stale deals before they are lost
- Coach with data, not impressions
🏢 Business Owner
- Revenue forecast from deal probabilities
- Lead source performance (IndiaMart vs TradeIndia)
- Month-on-month growth at a glance
- Automated daily report in email
📱 Field Executive
- Full dashboard on mobile app
- Add updates via speech-to-text
- Log calls and check-ins on the go
- Geo-tracked activity visible to manager
Common Mistakes Businesses Make With Their CRM Dashboard
- Not using it daily — a dashboard only has value if it is opened every morning before the day begins
- Not updating the CRM after calls — the dashboard is only as good as the data behind it; a team that does not update records after every interaction will see a useless dashboard
- Ignoring open reminders — if the follow-up count is visible but ignored, the dashboard is decorative
- Looking at total leads instead of movement — the number of leads is less important than how many are moving through stages
- Not customising views by role — a salesperson's dashboard and a business owner's dashboard should not show the same things
Open your CRM dashboard before you open WhatsApp. This one habit, if adopted by your whole team, will change how your business operates within 30 days. The dashboard becomes the source of truth. Everything else becomes a tool to act on what you see there.
Frequently Asked Questions
What is a CRM dashboard?
How does a CRM dashboard help business growth?
What should a CRM dashboard show?
Does Clientfisher have a mobile CRM dashboard?
How is Clientfisher's dashboard designed for Indian SMBs?
See the Clientfisher Dashboard Live
Book a free 20-minute demo and watch how your pipeline, follow-ups, and team activity look in real time — built for Indian SMBs since 2012.